
Trading
8 minutes read
Jun 2, 2025
What is Buyside and Sellside Liquidity? And How Does It Work?
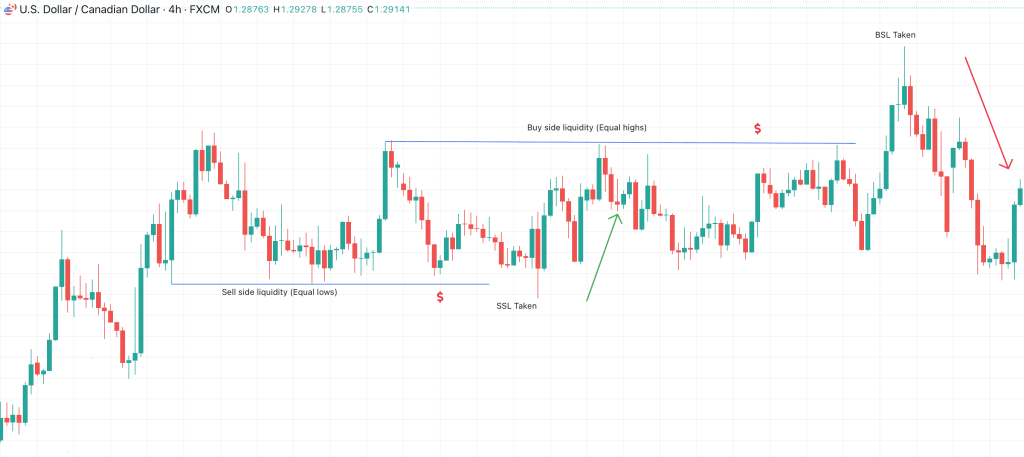
Liquidity drives every movement in financial markets. Behind each price shift is a balance, or imbalance, between buyers and sellers. Two core concepts that define this dynamic are buy-side liquidity and sell-side liquidity. These terms describe where large clusters of pending orders sit on the price chart, and they reveal how market participants, especially institutional traders, position themselves around key levels.
Understanding how buy-side and sell-side liquidity work helps traders anticipate price targets, reversals, and volatility spikes. This article breaks down these concepts clearly and shows how they influence execution, strategy, and market structure.
Understanding Buy-Side and Sell-Side Liquidity
In financial markets, liquidity refers to the ease with which assets can be bought or sold without causing significant price changes. Two critical components of market liquidity are buy-side liquidity and sell-side liquidity, which represent areas on a price chart where pending buy or sell orders are concentrated. These zones are pivotal in understanding market movements and potential reversals.
What Is Buy-Side Liquidity?
Buy-side liquidity refers to clusters of pending buy orders positioned above the current market price. These are often stop-loss orders from short traders, meaning they’ve sold an asset expecting it to fall in value. When price moves upward and reaches these zones, those stop orders trigger as the market buys, creating upward pressure.
These zones are typically found:
- Above recent swing highs
- Near resistance levels
- Around previous breakout points
Institutional traders often target these areas. By pushing price into buy-side liquidity, they activate stop orders from retail traders, which creates volume and fills their own sell positions at premium prices. This behavior is sometimes referred to as a “liquidity sweep” or “stop hunt.”
Key Takeaways:
- Buy-side liquidity sits above the current price.
- It often includes buy stop orders from short positions.
- When triggered, it can cause short-term price spikes.
- Institutions use it to execute large sell orders efficiently.
What Is Sell-Side Liquidity?
Sell-side liquidity refers to a concentration of pending sell orders positioned below the current market price. These are typically stop-loss orders from traders who are long, traders who bought an asset expecting it to rise. When price drops into these zones, their stops trigger as market sell orders, adding downward momentum.
Sell-side liquidity is often located:
- Below recent swing lows
- Near support levels
- At failed breakout or pullback zones
Institutional traders look to enter large buy positions in these areas. By driving prices down into sell-side liquidity, they trigger stop-losses from retail longs. These sell orders provide the volume institutions need to open large long positions without slippage. Once filled, price often reverses quickly, trapping retail traders on the wrong side of the move.
Key Takeaways:
- Sell-side liquidity sits below the current price.
- It includes sell stop orders from long positions.
- Triggers can cause sudden price drops or “flushes.”
- Institutions often buy into this forced selling to gain efficient long-term exposure.
How Liquidity Zones Influence Price Movement
Buy-side and sell-side liquidity zones act like magnets for price. These areas contain resting orders that, once triggered, increase volume and volatility. Institutions and smart money traders often manipulate prices to reach these zones, not by accident, but by design. Their goal is to trigger retail stop orders and fill large positions efficiently, without revealing their intent.
When price moves toward liquidity:
- It accelerates due to automated order activation.
- Spikes in volume occur as stop-losses convert into market orders.
- Institutions use this flow to enter opposite-direction trades (sell at buy-side, buy at sell-side).
This behavior explains why price often runs swing highs or lows, only to reverse sharply. These are not failed breakouts, they’re intentional moves into liquidity zones where large players are waiting.
Example Behavior:
- Price pushes above a recent high → triggers buy stops → institutions sell into it → price reverses.
- Price drops below a swing low → triggers sell stops → institutions buy the dip → price bounces.
How Traders Use Liquidity Zones in Their Setups
Understanding liquidity zones allows traders to position themselves more effectively, not where the crowd reacts, but where institutions act. Instead of chasing breakouts or reacting to volatility, experienced traders use these zones to anticipate stop hunts, fakeouts, and reversals.
- Entry Triggers: Wait for price to sweep a liquidity zone (above highs or below lows), then show signs of rejection or reversal.
- Risk Placement: Place stops just beyond liquidity zones to avoid being part of the stop run.
- Trade Direction: Look for long trades after sell-side liquidity is cleared; look for shorts after buy-side liquidity is swept.
- Time Entry: Use lower timeframes to confirm reversal structures once liquidity has been tapped.
Traders who understand how liquidity drives price can align their strategy with institutional behavior rather than reacting to it. This shift in perspective improves accuracy, reduces stop-outs, and adds clarity to market structure.
Example Setup:
Price pushes above recent high into buy-side liquidity → sharp rejection candle → short entry on lower timeframe → stop placed above sweep high.
Liquidity and Market Structure
Liquidity zones are not isolated events, they’re tied directly to market structure. Understanding where liquidity sits helps traders read price context more accurately. For example, a break of structure (BOS) that sweeps a liquidity zone signals stronger intent than a random candle pattern.
In a bullish structure:
- Buy-side liquidity often builds above swing highs.
- Sell-side liquidity forms below higher lows.
- Price often sweeps sell-side liquidity before forming a higher low and resuming upward.
In a bearish structure:
- Sell-side liquidity pools below swing lows.
- Buy-side liquidity builds above lower highs.
- Price often sweeps buy-side stops before continuing down.
Traders who track liquidity within market structure can anticipate where reversals are likely and identify which liquidity grabs are traps vs. legitimate trend shifts.
Liquidity and Timeframes
Liquidity exists across all timeframes, but its relevance depends on the strategy. Higher timeframes (4H, Daily) show major liquidity zones where institutions operate. Lower timeframes (5M, 15M) show execution-level sweeps that traders use for entry triggers.
- Swing traders focus on liquidity around weekly and daily highs/lows.
- Intraday traders look for liquidity near session opens, news levels, and intraday structure.
- Scalpers rely on micro liquidity levels around local highs/lows or VWAP extremes.
Combining higher-timeframe liquidity with lower-timeframe confirmation gives traders multi-timeframe alignment, improving setup quality and trade conviction.
Liquidity and Trade Timing
Liquidity zones not only influence where price is likely to move, but they also affect when traders should act. Executing a trade just before the price enters a liquidity zone often results in getting stopped out. Smart timing involves waiting for liquidity to be taken, and then entering once the reaction confirms the market’s true direction.
For example:
- Entering short before buy-side liquidity is cleared exposes the trader to a squeeze.
- Entering long just before sell-side liquidity is tapped often leads to getting caught in a flush.
- The ideal entry often comes after a sweep, when the market shows rejection, imbalance, or strong reversal momentum.
Waiting for liquidity to get cleared helps avoid premature entries and aligns your timing with how institutional traders manage execution. It’s not just about direction, it’s about letting the market show its hand first.
Liquidity and Stop Hunts
Stop hunts are price moves designed to trigger stop-loss orders placed around predictable levels. These moves often clear liquidity before the market reverses. Traders unfamiliar with liquidity dynamics often mistake stop hunts for real breakouts and enter too late, just as institutions are closing or reversing their own positions.
Key signs of a stop hunt:
- Price breaks just above a swing high or below a swing low.
- Large wick forms show immediate rejection.
- No volume follow-through after the breakout.
- Quick reversal back into the previous range.
Recognizing stop hunts helps traders avoid false breakouts and instead position on the right side of liquidity-driven reversals.
Liquidity and Risk Management
Liquidity concepts are not just for entries, they improve risk placement and trade sizing. Placing stop-losses in obvious liquidity zones makes traders easy targets. Institutions know where the majority of stops cluster and often target those levels before making the real move.
- Placing stops beyond liquidity zones, not inside them.
- Reducing size when trading near known liquidity targets.
- Scaling into positions after a liquidity sweep confirms a reversal.
- Using liquidity zones to set profit targets, not just entries.
By using liquidity zones to frame both entries and exits, traders can build setups with higher accuracy, tighter risk, and better asymmetric potential.
Liquidity in Algorithmic and Institutional Trading
Liquidity zones are not only visible to human traders, they’re deeply embedded in the logic of algorithmic and institutional trading systems. Many market-making and execution algorithms are programmed to seek out liquidity pools where large orders can be filled with minimal slippage.
These systems analyze:
- Order book depth
- Volume clusters
- Historical swing highs/lows
- Time-based liquidity (session opens/closes, news releases)
Algorithms often drive prices toward these zones intentionally, triggering stop orders and generating the volume required to fill institutional-sized trades. This explains why price frequently moves to predictable highs or lows, not because of random chance, but because liquidity is mathematically optimal there.
Understanding that price is engineered, not chaotic, gives traders an edge in anticipating movement and aligning with larger market participants.
Conclusion
Liquidity zones reveal where the price is most likely to react. They expose the behavior of both retail traders and institutions. Knowing where buy-side and sell-side liquidity sits, and how it’s used, shifts a trader’s focus from prediction to reaction. Price doesn’t move randomly. It moves toward liquidity, fills large orders, and often reverses. Understanding that flow gives traders a clearer edge, stronger setups, and more reliable trade timing.
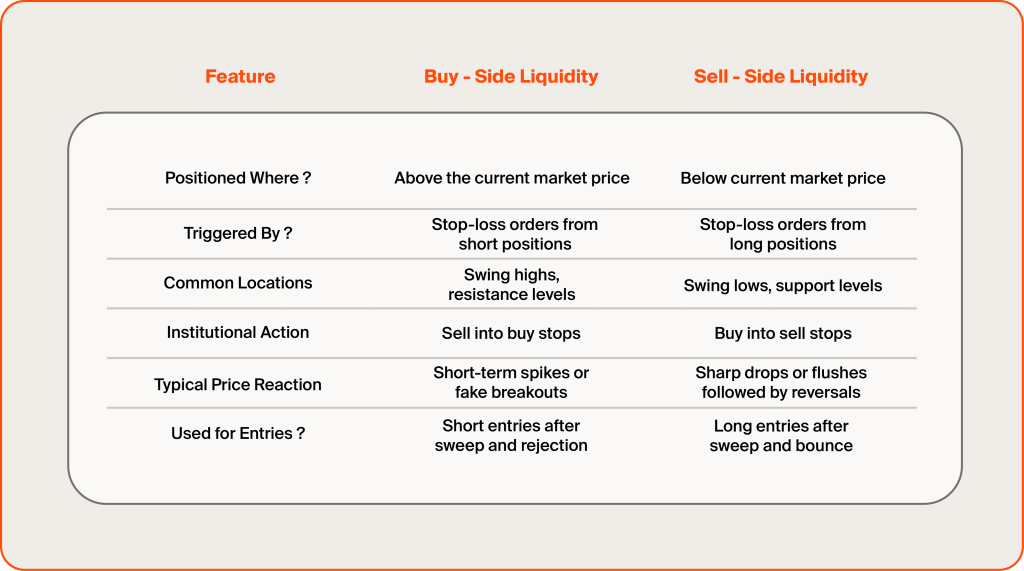
Here’s a final Buy-Side vs. Sell-Side Liquidity table:
FAQ
890

Written by Ivan Bogatyrev
Business Development at FintechFuel
Writing about the exciting worlds of iGaming and the brokerage business, breaking down the latest trends and insights. Making complex topics easy to understand, helping readers stay informed and ahead of the curve.
More by authorRead more
Brokerage Business
9 minutes read
Apr 28, 2026
When conversion drops, the funnel is often fine — payments, KYC, support, and affiliate ops are not. Here is what breaks first, what to fix in order, and how to avoid mistaking an ops crisis for a marketing problem.
